File:ElectricalResisitivityProfileRepresentativeHillslope.jpg
ElectricalResisitivityProfileRepresentativeHillslope.jpg (450 × 315 pixels, file size: 31 KB, MIME type: image/jpeg)
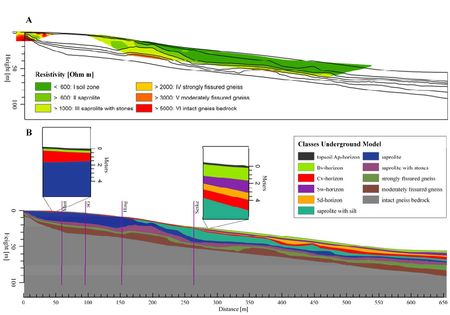
A: Electrical resistivity profiles Q10 (small, left) and Q12 (large, right) aligned with the representative hillslope. Black lines show the boundaries of the weathering classes. B: Underground model of the Wettzell hillslope. The surface gradient corresponds to the representative hillslope. Underground classes have been derived from the relationship between resistivity and degree of weathering (Table 5-1) for the rock zone, and from soil classification and grain size analyses for the saprolite and soil zone. Vertical lines in purple designate locations of soil pits Mast, SG, Hang and Senke.
File history
Click on a date/time to view the file as it appeared at that time.
| Date/Time | Thumbnail | Dimensions | User | Comment | |
|---|---|---|---|---|---|
| current | 12:43, 3 April 2012 | | 450 × 315 (31 KB) | Ban (talk | contribs) | A: Electrical resistivity profiles Q10 (small, left) and Q12 (large, right) aligned with the representative hillslope. Black lines show the boundaries of the weathering classes. B: Underground model of the Wettzell hillslope. The surface gradient correspo |
You cannot overwrite this file.
File usage
The following page uses this file: