File list
Jump to navigation
Jump to search
This special page shows all uploaded files.
| Date | Name | Thumbnail | Size | User | Description | Versions |
|---|---|---|---|---|---|---|
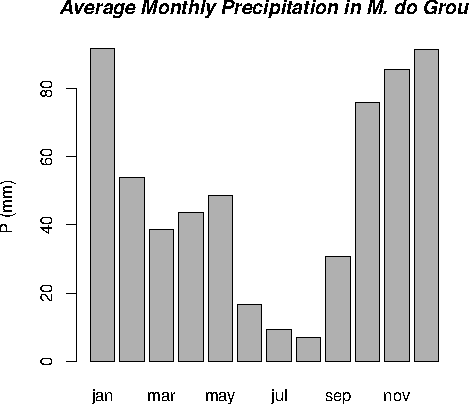
| 17:58, 6 February 2015 | Prec.png (file) |  |
2 KB | Jmigueldelgado | Average monthly precipitation at Machuqueira do Grou. Data provided by SNIRH. | 1 |
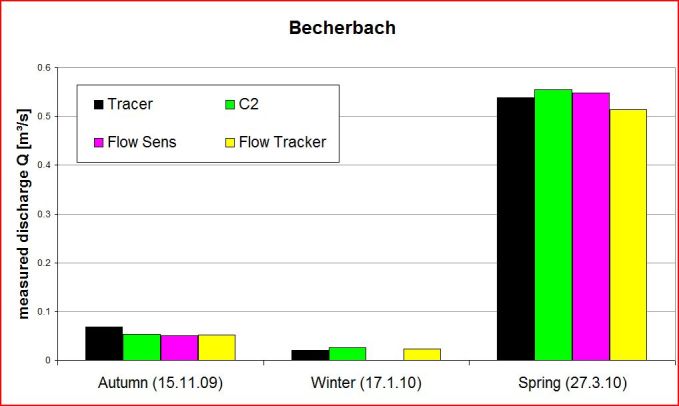
| 15:23, 3 August 2010 | Vgl Messmeth Jahresz BB.pdf (file) | 5 KB | Janek Dreibrodt | 1 | ||
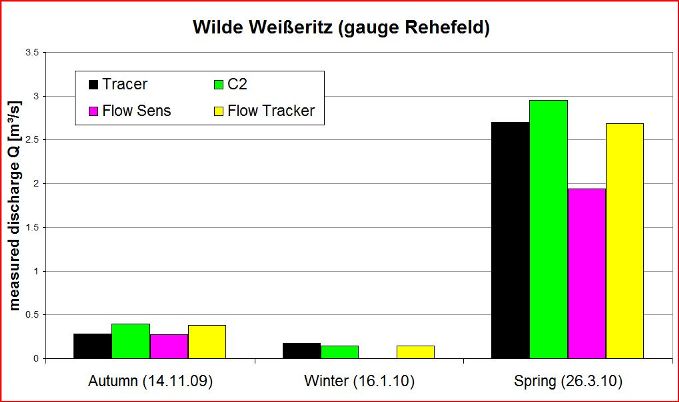
| 15:24, 3 August 2010 | Vgl Messmeth Jahresz WW.pdf (file) | 5 KB | Janek Dreibrodt | 1 | ||
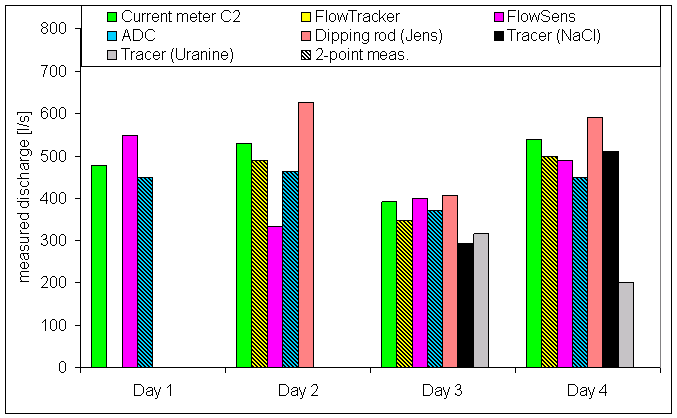
| 13:03, 28 September 2009 | Discharge comparison.png (file) |  |
5 KB | Till | comparison of discahrge values obtained with different methods | 1 |
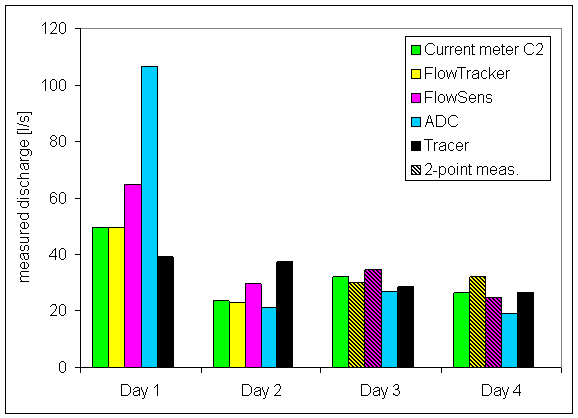
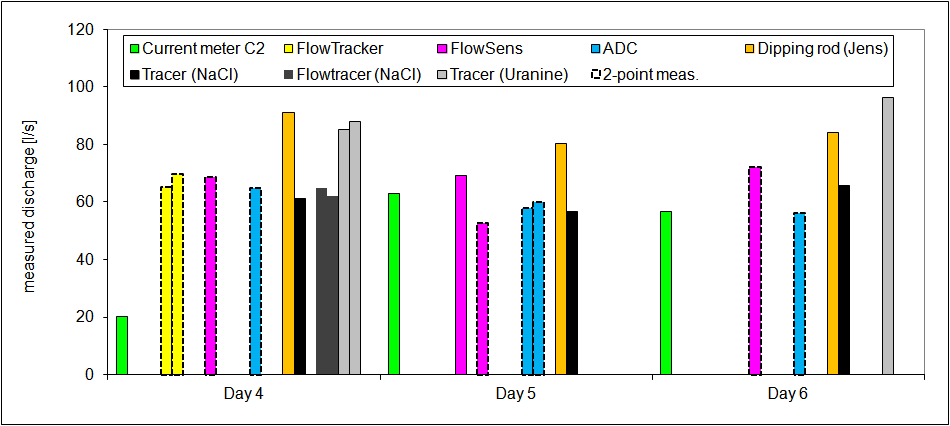
| 16:31, 10 May 2010 | Discharge comparison 2009.png (file) |  |
5 KB | Till | comparison of discharge measurements using different methods | 1 |
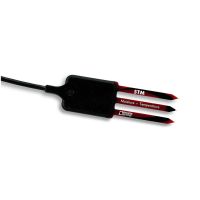
| 10:51, 9 June 2011 | Decagon 5 TM.jpg (file) |  |
6 KB | Thomas | Decagon 5 TM probe | 1 |
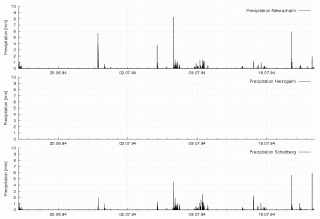
| 14:29, 12 March 2007 | Precipitation.png (file) |  |
7 KB | Pezi | Plot of precipitation records | 2 |
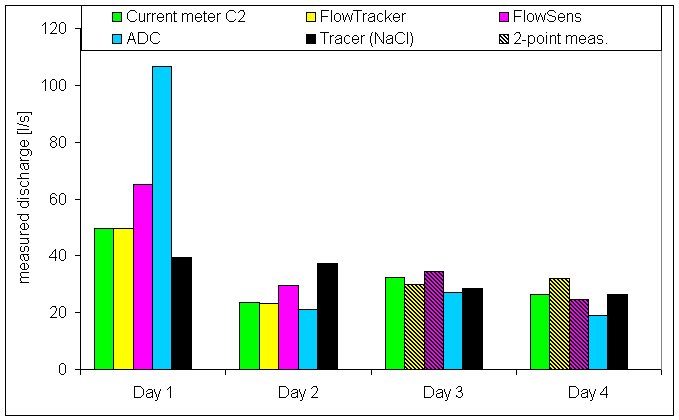
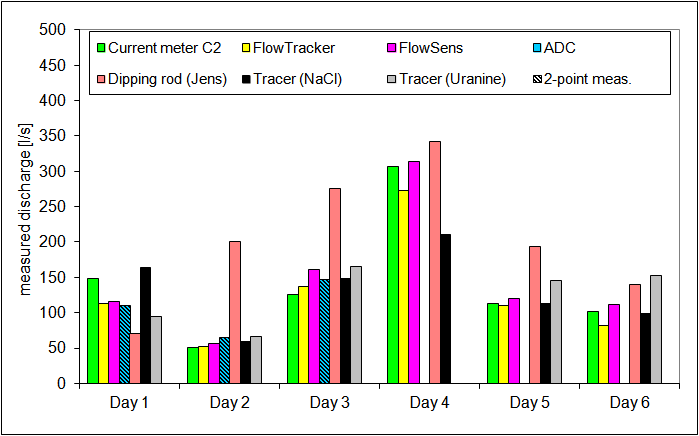
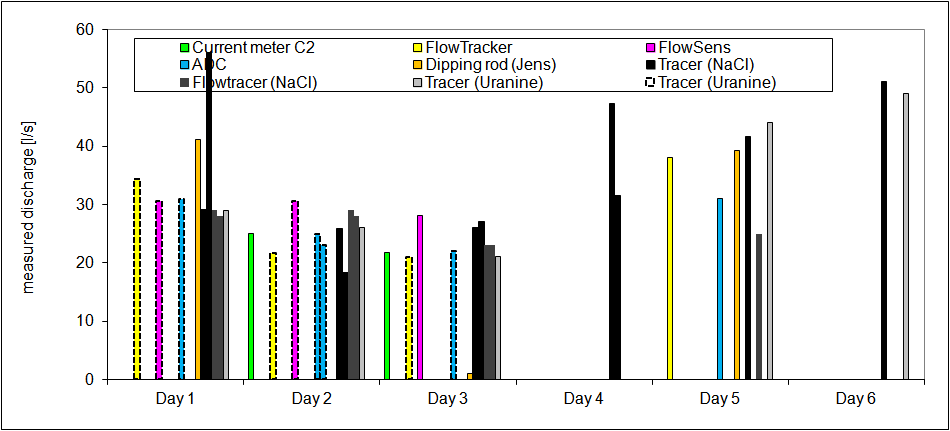
| 16:31, 10 May 2010 | Discharge comparison 2010.png (file) |  |
8 KB | Till | comparison of discharge measurements using different methods (2010) | 1 |
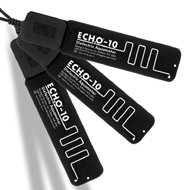
| 02:29, 14 April 2007 | EC10.jpg (file) |  |
9 KB | Ilja | EC-10 ECHO | 1 |
| 12:59, 23 July 2007 | HoboErrMsg1.jpg (file) |  |
11 KB | Dkneis | 1 | |
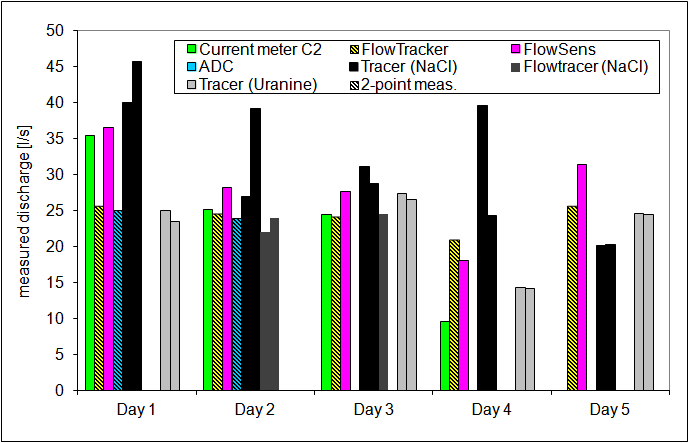
| 13:46, 20 September 2011 | 2011 discharge.png (file) |  |
13 KB | Till | comparison of discahrge measurements | 1 |
| 16:07, 21 September 2015 | 2014 discharge.png (file) |  |
14 KB | Till | comparison of discharge measurements, Selke 2014 | 1 |
| 22:15, 9 July 2009 | Image2.gif (file) | 14 KB | Dk9uv | 2 | ||
| 16:07, 21 September 2015 | 2015 discharge.png (file) |  |
14 KB | Till | comparison of discharge measurements, Selke 2015 | 1 |
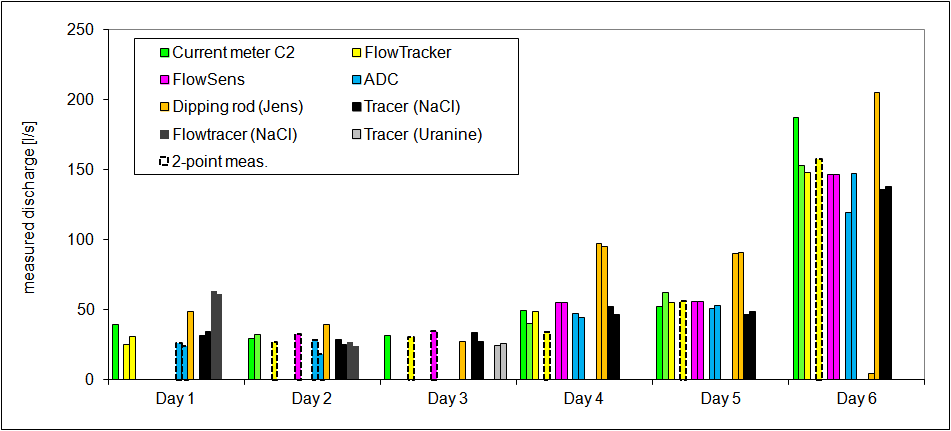
| 16:33, 2 November 2012 | 2012 discharge.png (file) |  |
15 KB | Till | Discharge measurement method comparison 2012, Harz | 1 |
| 09:02, 10 October 2013 | 2013 discharge.png (file) |  |
15 KB | Till | comparison of discharge measurements, Harz 2013 | 1 |
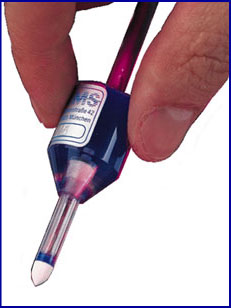
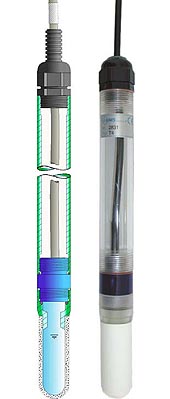
| 01:12, 27 March 2007 | T5-tensiometer.jpg (file) |  |
15 KB | Ilja | T5 tensiometer | 1 |
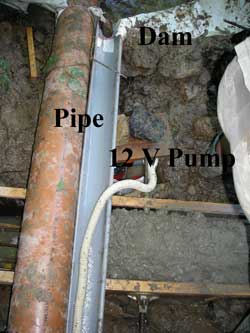
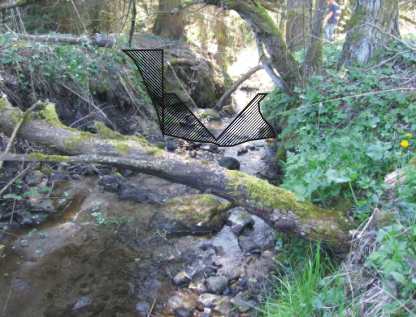
| 22:36, 7 August 2007 | WeirAccumulationDrainage1.jpg (file) |  |
15 KB | Ban | Accumulation and Drainage of the Water | 1 |
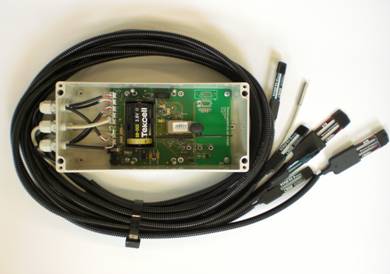
| 23:32, 8 July 2009 | SoilNet End Device.jpg (file) |  |
15 KB | Theresa | 1 | |
| 09:53, 8 November 2013 | Ml3 deltaT.jpg (file) |  |
15 KB | Thomas | delta T ML3 probe | 1 |
| 10:43, 9 June 2011 | Wetsensor.gif (file) |  |
15 KB | Thomas | delta t wet sensor | 1 |
| 13:00, 23 July 2007 | HoboErrMsg2.jpg (file) |  |
17 KB | Dkneis | 1 | |
| 17:54, 6 March 2007 | CrossingTresArroyos.jpg (file) |  |
19 KB | WikiSysop | 1 | |
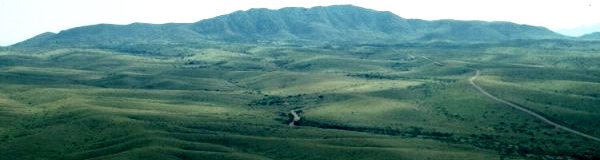
| 23:20, 9 November 2013 | Wng.jpg (file) | 19 KB | Thomas | View into the Walnut Gulch Experimental Watershed | 1 | |
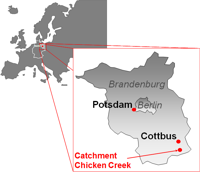
| 16:08, 11 February 2016 | Huehnerwasser.png (file) |  |
19 KB | Wgerwin | 2 | |
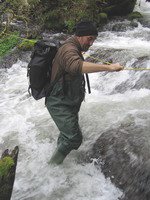
| 17:53, 6 March 2007 | Streamflow.jpg (file) |  |
21 KB | WikiSysop | 1 | |
| 14:32, 6 March 2007 | Streamflow1.jpg (file) |  |
21 KB | Theresa | 1 | |
| 21:59, 7 August 2007 | WeirPlanning.jpg (file) |  |
24 KB | Ban | Planning of a v notch weir | 2 |
| 12:30, 8 March 2007 | Example.jpg (file) |  |
25 KB | Miriam Gerrits | 1 | |
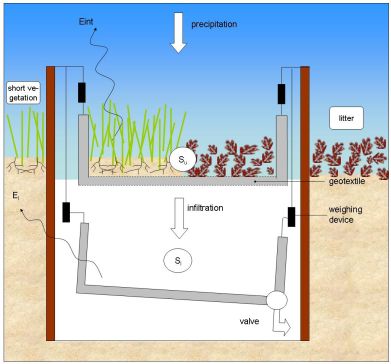
| 12:35, 8 March 2007 | Forest floor interception device.jpg (file) |  |
25 KB | Miriam Gerrits | 1 | |
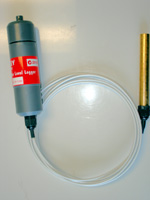
| 01:03, 27 March 2007 | Odyssey.jpg (file) |  |
25 KB | Ilja | water level - capacitive (2) Odyssey | 1 |
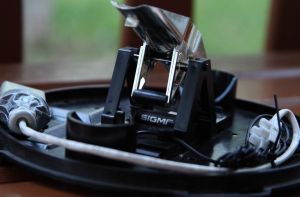
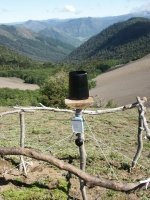
| 09:38, 1 July 2011 | Davis sigma.jpg (file) |  |
26 KB | Till | Davis-rain gauge fixed with Sigma bicycle computer sensor, attached to Hobo event logger | 1 |
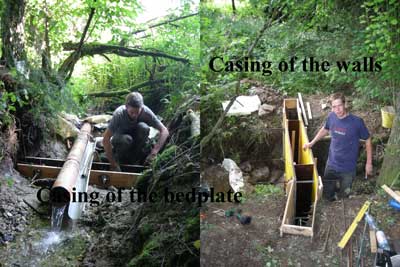
| 00:16, 8 August 2007 | WeirCasing.jpg (file) |  |
26 KB | Ban | Casing of the weir | 1 |
| 12:19, 21 July 2011 | Multiparameter ms5 ott.jpg (file) |  |
26 KB | Thomas | multiparameter probe ms 5 ott | 1 |
| 14:42, 8 August 2007 | Ombrometer.jpg (file) |  |
27 KB | Ban | Rainfall tipping bucket | 1 |
| 11:46, 19 October 2007 | Hydra probe.jpg (file) |  |
27 KB | Thomas | Hydra probe | 1 |
| 21:53, 9 April 2007 | 114 T4 Tensiometer.jpg (file) |  |
27 KB | W75 | 1 | |
| 17:53, 6 March 2007 | Raingauge.jpg (file) |  |
28 KB | WikiSysop | 1 | |
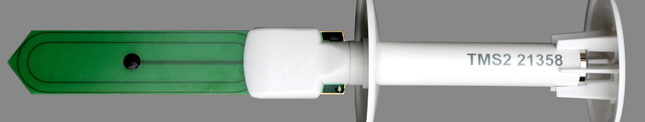
| 09:32, 26 September 2013 | Tms1.jpg (file) | 31 KB | Thomas | TMS soil moisture sensor | 1 | |
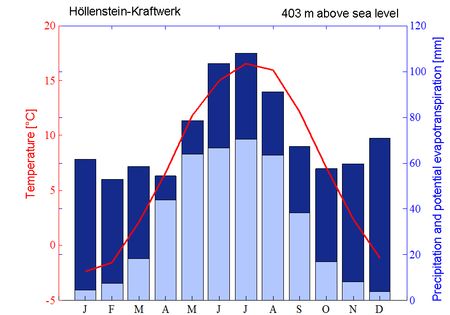
| 12:39, 3 April 2012 | ClimateChartWeatherStationHoellensteinKraftwerk.jpg (file) |  |
31 KB | Ban | Climate chart of the nearby weather station Höllenstein-Kraftwerk. The red line indicates the monthly mean temperature. Dark blue bars represent the monthly sum of precipitation; light blue bars represent monthly sums of potential evapotranspiration acco | 1 |
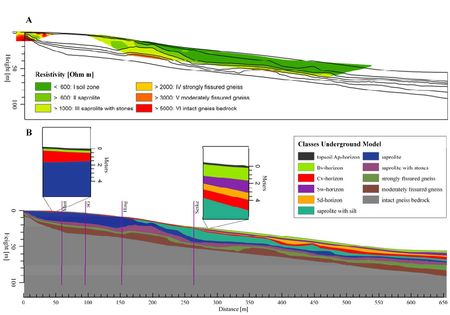
| 12:43, 3 April 2012 | ElectricalResisitivityProfileRepresentativeHillslope.jpg (file) |  |
31 KB | Ban | A: Electrical resistivity profiles Q10 (small, left) and Q12 (large, right) aligned with the representative hillslope. Black lines show the boundaries of the weathering classes. B: Underground model of the Wettzell hillslope. The surface gradient correspo | 1 |
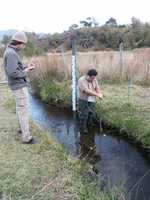
| 15:48, 3 August 2010 | Becherbach Wiki.jpg (file) |  |
35 KB | Janek Dreibrodt | 2 | |
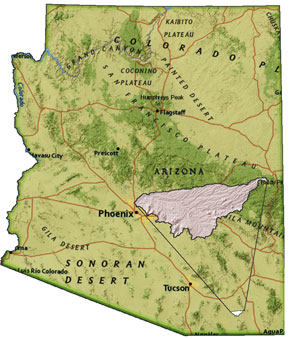
| 23:36, 9 November 2013 | WalnutGulch Map.jpg (file) |  |
36 KB | Thomas | Location of the Walnut Gulch Experimental Watershed, Arizona, USA | 1 |
| 03:12, 6 January 2009 | Aquapro.JPG (file) |  |
37 KB | Ilja | Aquapro | 1 |
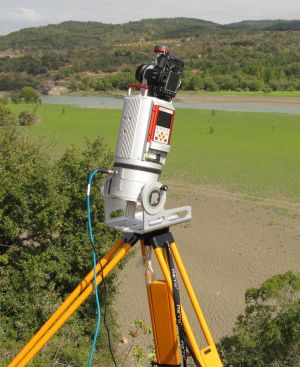
| 10:43, 1 June 2011 | Riegl vz-400.jpg (file) |  |
37 KB | Till | Riegl VZ-400 used for scanning empty reservoir, NE-Spain | 1 |
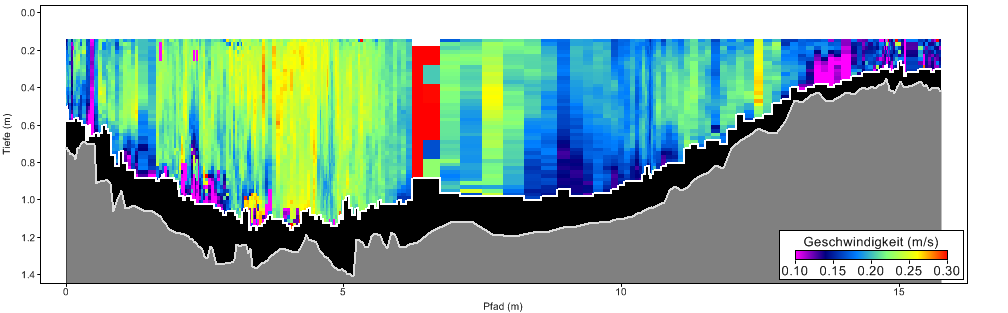
| 15:53, 8 December 2014 | ADCP.png (file) |  |
38 KB | Till | Example plot of flow velocities along a river cross section obtained with the RiverSurveyor (ADCP) | 1 |
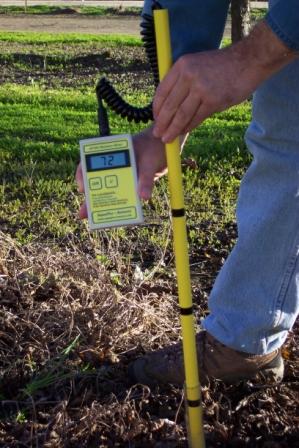
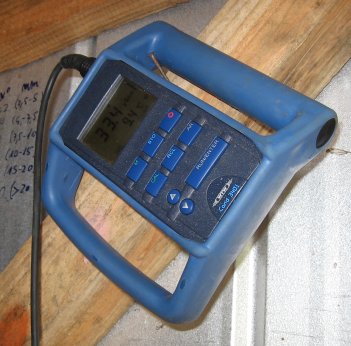
| 12:27, 31 January 2008 | ECmeter.jpg (file) |  |
39 KB | Theresa | 1 | |
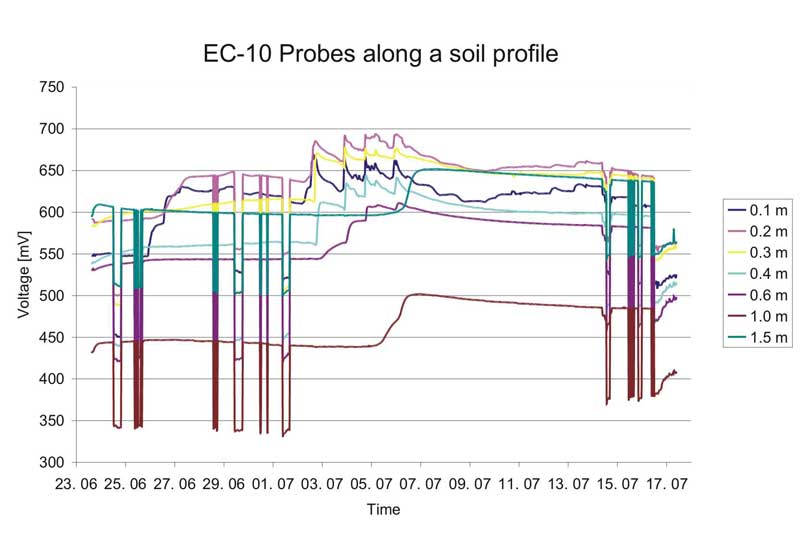
| 14:37, 8 August 2007 | ECHOProbesSoilProfile.jpg (file) |  |
39 KB | Ban | ECHO Soil Profile | 1 |
| 13:38, 8 March 2007 | Luxembourg int box framed.jpg (file) |  |
40 KB | Miriam Gerrits | 4 | |
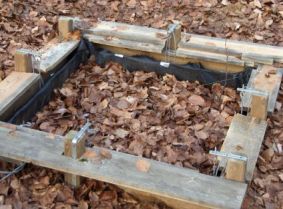
| 15:48, 3 August 2010 | Weißeritz Wiki.jpg (file) |  |
41 KB | Janek Dreibrodt | 2 |