Difference between revisions of "Discharge - comparison of measurements (C2, Flowtracker, Flowsens, ADC, tracer, dipping rod)"
m (→Settings) |
|||
| Line 1: | Line 1: | ||
| − | This page gives an account on the experience gained during two 4-day student course in field-hydrology. Discharge was measured using the [[Discharge - Current meter Ott C2|Current meter OTT C2]], [[Discharge - ultrasonic Doppler FlowTracker|Flowtracker]], [[Discharge - electromagnetic flowmeter FlowSens|Flowsens]], [[Discharge - Ott ADC|ADC]], Tracer Dilution method (NaCl, [[Electric conductivity - WTW cond340i|WTW cond340i]]) and fluorimeter MFT. It is far from being a systematic and conclusive test, nevertheless it gives some impression on trends in usability for untrained personnel. | + | This page gives an account on the experience gained during two 4-day student course and a 3x2-day student project in field-hydrology. Discharge was measured using the [[Discharge - Current meter Ott C2|Current meter OTT C2]], [[Discharge - ultrasonic Doppler FlowTracker|Flowtracker]], [[Discharge - electromagnetic flowmeter FlowSens|Flowsens]], [[Discharge - Ott ADC|ADC]], Tracer Dilution method (NaCl, [[Electric conductivity - WTW cond340i|WTW cond340i]]) and fluorimeter MFT. It is far from being a systematic and conclusive test, nevertheless it gives some impression on trends in usability for untrained personnel. |
== Settings == | == Settings == | ||
| Line 8: | Line 8: | ||
** Location: 40 m upstream of site of 2009, sections 5 m apart. On day 3, water stage was 3 cm lower than on days 1, 2 and 4. | ** Location: 40 m upstream of site of 2009, sections 5 m apart. On day 3, water stage was 3 cm lower than on days 1, 2 and 4. | ||
** Methods: Analogous to above. The number of verticals was 12 along the sections with ca. 3.5 m width and 0-75 cm water depth. Discharge was also determined by the tracer dilution method (NaCl), with a pulse injection of 1 (Day 1), 2 (Day 2 and 3) and 2.5 kg (Day 4) of NaCl 70 m upstream and measuring electric conductivity as a proxy for concentration. Likewise, Uranine (Fluorescine) was applied and measured using the field fluorimeter Sommer MFT. The dipping rod according to Jens used was limited to depths < 60 cm. At some measurements, this depth was exceeded by up to 15 cm. In these cases, the true depth was used for computation, but the measurement restricted to the top 60 cm. | ** Methods: Analogous to above. The number of verticals was 12 along the sections with ca. 3.5 m width and 0-75 cm water depth. Discharge was also determined by the tracer dilution method (NaCl), with a pulse injection of 1 (Day 1), 2 (Day 2 and 3) and 2.5 kg (Day 4) of NaCl 70 m upstream and measuring electric conductivity as a proxy for concentration. Likewise, Uranine (Fluorescine) was applied and measured using the field fluorimeter Sommer MFT. The dipping rod according to Jens used was limited to depths < 60 cm. At some measurements, this depth was exceeded by up to 15 cm. In these cases, the true depth was used for computation, but the measurement restricted to the top 60 cm. | ||
| + | * Date: 14/15. Nov. 2009; 16/17. Jan. 2010; 26/27. Mar. 2010 | ||
| + | ** Location: '''Wilde Weißeritz''' at the concreted profile of gauge Rehefeld, Erzgebirge, Germany. Water flow is almost linear. '''Becherbach''' flows into the Wilde Weißeritz ca. 3.5 km downstream gauge Rehefeld. The measuring point is in the natural streambed ca. 100 m upstream the estuary in the Wilde Weißeritz. The water flow is very turbulent. | ||
| + | ** Methods: During the student project C2, Flowsens (except the January measurement), Flowtracker and a tracer dilution method (NaCl, pulse injection) were used. The students had little previous experience with the methods. The measurements with C2, Flowsens and Flowtracker were 1-point measurements. The tracer was injected 150 m upstream the measuring points. The water levels (cm at gauge) and the tracer mass (gram) at the Wilde Weißeritz were 21 cm / 241 g, 14 cm / 327 g , 58 cm / 1028 g and at the Becherbach 129 cm / 230 g , 112 cm / 372 g , 238 cm / 517 g. | ||
| + | |||
== Results == | == Results == | ||
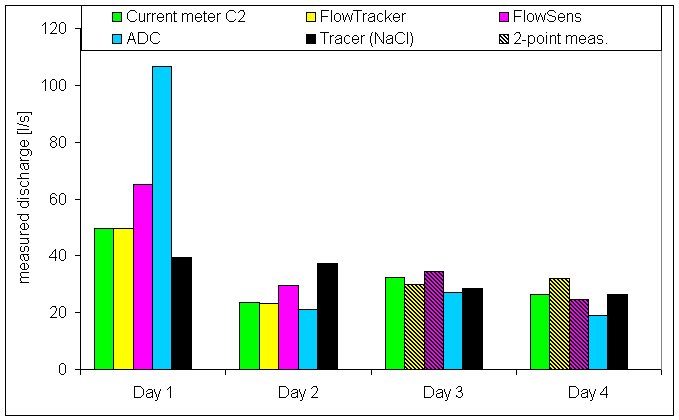
[[Image:discharge_comparison_2009.png]] | [[Image:discharge_comparison_2009.png]] | ||
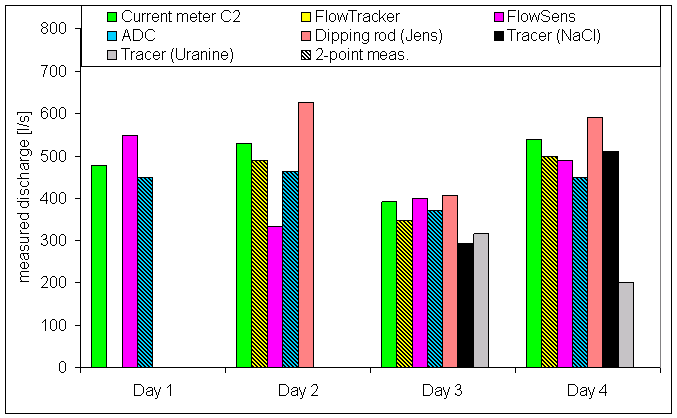
[[Image:discharge_comparison_2010.png]] | [[Image:discharge_comparison_2010.png]] | ||
| + | |||
== Comments == | == Comments == | ||
* 2009 | * 2009 | ||
Revision as of 15:32, 3 August 2010
This page gives an account on the experience gained during two 4-day student course and a 3x2-day student project in field-hydrology. Discharge was measured using the Current meter OTT C2, Flowtracker, Flowsens, ADC, Tracer Dilution method (NaCl, WTW cond340i) and fluorimeter MFT. It is far from being a systematic and conclusive test, nevertheless it gives some impression on trends in usability for untrained personnel.
Settings
- Date: 14. - 17. Sept. 2009
- Location: Selke-stream, downstream Güntersberge, Harz-mountains, Germany, at two similar sections, ca. 7 m apart. Water flow was almost laminar with moderate turbidity, which was sometimes increased by upstream wading. Within the four days, no change in water level was perceived, so discharge must be assumed nearly constant.
- Methods: Each day, a new group of student with only basic background knowledge was introduced to the equipment. Except for days 3 and 4, only 1-point measurements (i.e. 1 velocity measurement per vertical) were performed. The number of verticals varied from 10 to 14 along the sections with ca. 3.5 m width and 0-40 cm water depth. Discharge was also determined by the tracer dilution method (NaCl), with a pulse injection of 0.5 (Days 1 and 2) and 1 kg of NaCl 30 m upstream and measuring electric conductivity as a proxy for concentration.
- Date: 12. - 15. Apr. 2010
- Location: 40 m upstream of site of 2009, sections 5 m apart. On day 3, water stage was 3 cm lower than on days 1, 2 and 4.
- Methods: Analogous to above. The number of verticals was 12 along the sections with ca. 3.5 m width and 0-75 cm water depth. Discharge was also determined by the tracer dilution method (NaCl), with a pulse injection of 1 (Day 1), 2 (Day 2 and 3) and 2.5 kg (Day 4) of NaCl 70 m upstream and measuring electric conductivity as a proxy for concentration. Likewise, Uranine (Fluorescine) was applied and measured using the field fluorimeter Sommer MFT. The dipping rod according to Jens used was limited to depths < 60 cm. At some measurements, this depth was exceeded by up to 15 cm. In these cases, the true depth was used for computation, but the measurement restricted to the top 60 cm.
- Date: 14/15. Nov. 2009; 16/17. Jan. 2010; 26/27. Mar. 2010
- Location: Wilde Weißeritz at the concreted profile of gauge Rehefeld, Erzgebirge, Germany. Water flow is almost linear. Becherbach flows into the Wilde Weißeritz ca. 3.5 km downstream gauge Rehefeld. The measuring point is in the natural streambed ca. 100 m upstream the estuary in the Wilde Weißeritz. The water flow is very turbulent.
- Methods: During the student project C2, Flowsens (except the January measurement), Flowtracker and a tracer dilution method (NaCl, pulse injection) were used. The students had little previous experience with the methods. The measurements with C2, Flowsens and Flowtracker were 1-point measurements. The tracer was injected 150 m upstream the measuring points. The water levels (cm at gauge) and the tracer mass (gram) at the Wilde Weißeritz were 21 cm / 241 g, 14 cm / 327 g , 58 cm / 1028 g and at the Becherbach 129 cm / 230 g , 112 cm / 372 g , 238 cm / 517 g.
Results
Comments
- 2009
The high values of Day 1 result from performing the 1-point measurement being conducted 40 % of the water depth measured from the surface instead of being measured from the ground. Thus, they cannot compared directly to the other days. The values show a bewildering variability (let's blame the students). Except for Day 1, the ADC apparently produces slightly lower values, whereas the Flowsens seems to yield somewhat higher discharge rates. For more conclusive results, the measurements need to be obtained with the identical number of verticals. We'll think about it for the next course.
- 2010
The failure of Flowtracker on day 1 was caused by erroneously operating the sensor 90° rotated.

