Uploads by Thomas
Jump to navigation
Jump to search
This special page shows all uploaded files.
| Date | Name | Thumbnail | Size | Description | Versions |
|---|---|---|---|---|---|
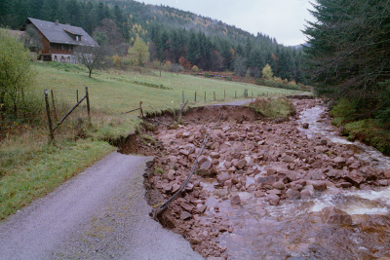
| 11:03, 5 April 2016 | NachHQ150 LÄNGSPROFIL98 B1 19A.png (file) |  |
202 KB | Flood damage after a flood event with a return period of 150 years in the Duerreich catchment | 1 |
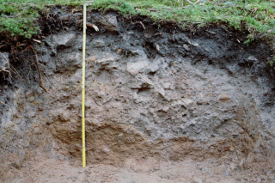
| 10:21, 5 April 2016 | BodenPROFIL1.png (file) |  |
112 KB | Typical soil profile of a Podzol in the Duerreich catchment | 1 |
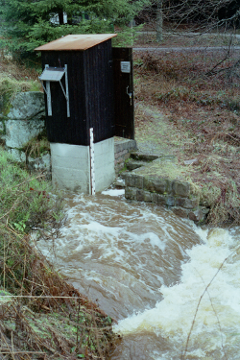
| 10:01, 5 April 2016 | PEGEL Dürreych FEBRUAR97 6A.png (file) |  |
183 KB | Gauging station Duerreich, flood event February 1997 | 1 |
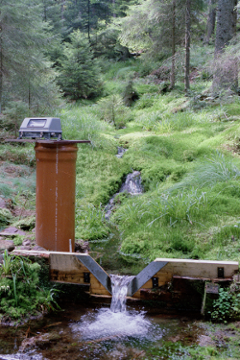
| 09:48, 5 April 2016 | PEGEL SQ.png (file) |  |
184 KB | V nodge gauging station Duerreich | 1 |
| 09:40, 5 April 2016 | Ultraschallpegel SEPTEMBER97 17A.png (file) |  |
174 KB | Ultrasonic gauging station Duerreich | 1 |
| 09:34, 5 April 2016 | Klimastation Freifläche FEBRUAR97 19A.png (file) |  |
173 KB | Meteorological station Duerreych catchment at clear cut site | 1 |
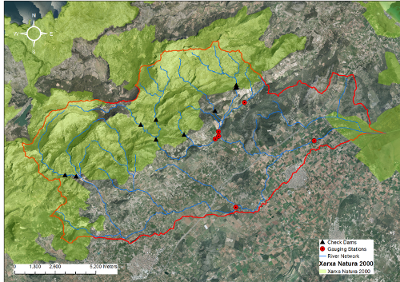
| 14:09, 19 February 2016 | SantMiquel gauging stations.png (file) |  |
284 KB | Delimitation of the Sant Miquel catchment. All the different gauging stations and check dams present in the catchment have been highlighted. The area included in the catchment which belongs to the Natura 2000 network has been also highlighted. | 1 |
| 14:07, 19 February 2016 | Santmiquel catchment and Natura2000.png (file) |  |
252 KB | Delimitation of the Sant Miquel catchment. All the different gauging stations and check dams present in the catchment have been highlighted. The area included in the catchment which belongs to the Natura 2000 network has been also highlighted. | 1 |
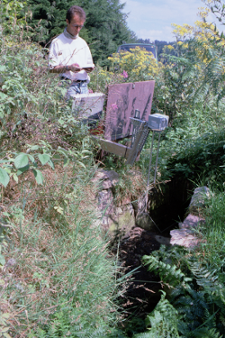
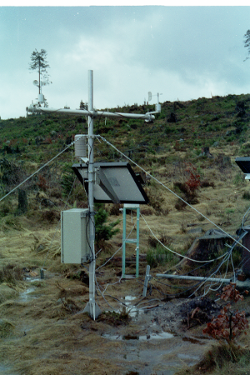
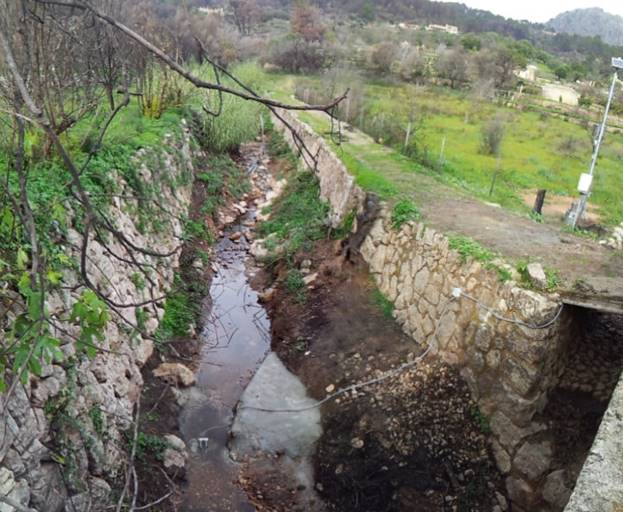
| 14:04, 19 February 2016 | Sa Font de la Vila gauging station.jpg (file) |  |
64 KB | Example of a measuring station: the Sa Murtera gauging station | 1 |
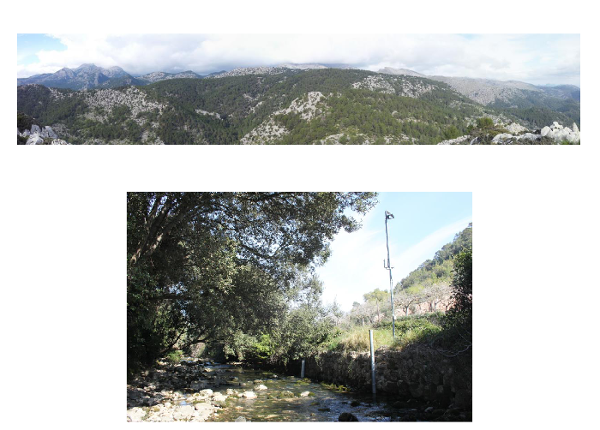
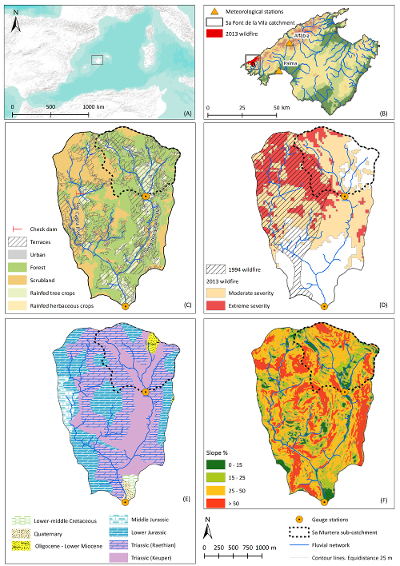
| 14:01, 19 February 2016 | Sa Font de la Vila catchment.jpg (file) |  |
269 KB | A) Location of Palma within the Mediterranean; B) Location of the Sa Font de la Vila catchment within the island of Mallorca; C) Main Landuses; D) Affectation of the 1994 and 2013 wildfires; E) Main geological units; F) Map of slopes. | 1 |
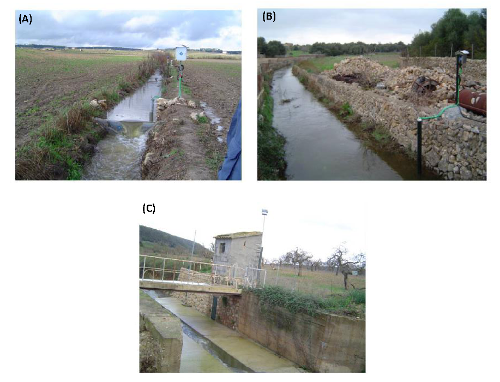
| 10:02, 18 February 2016 | Gauges of the Na Borges catchment.png (file) |  |
218 KB | (A) An upstream view of the Can Revull (1 km2) monitoring station; (B) Downstream view of the Son Pou (142 km2) monitoring station; (C) Downstream view of the Sa Vall (264 km2) gauging station. Figure adapted from Estrany (2009) | 1 |
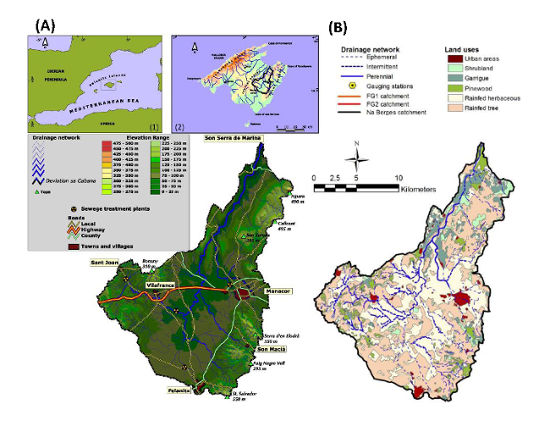
| 09:59, 18 February 2016 | Na Borges catchment.png (file) |  |
222 KB | (A) Map of the Na Borges catchment; upset maps show: (1) Mallorca location in the Western Mediterranean, (2) Na Borges catchment location in Mallorca. (B) Main land uses at the Na Borges catchment. Figure adapted from Estrany (2009) and López-Tarazón an | 1 |
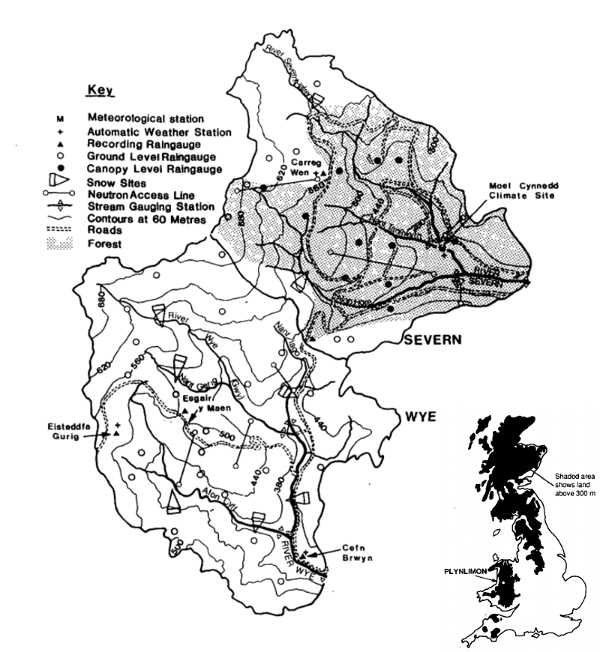
| 12:47, 17 February 2016 | Plynlimon X.png (file) |  |
275 KB | Plynlimon catchments, Wales, UK | 1 |
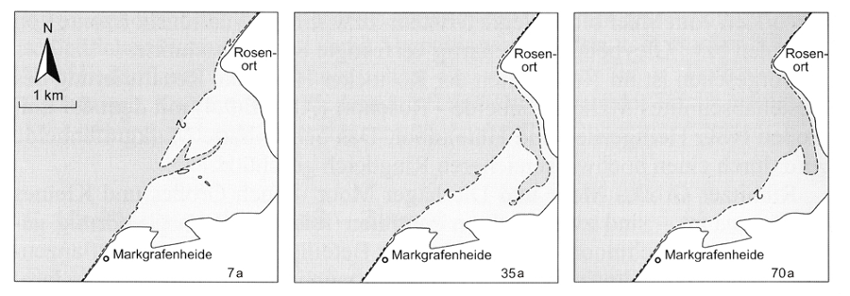
| 16:44, 8 October 2015 | Huetelmoor Heiliger See evolution.png (file) |  |
184 KB | Possible future evolution of the nature conservation area Huetelmoor / Heiliger See, in the landscape unit of the Rostocker Heide in the next 7 a, 35 a and 70 a, after dune breach, development plan for the nature conservation area Huetelmoor / Heiliger Se | 1 |
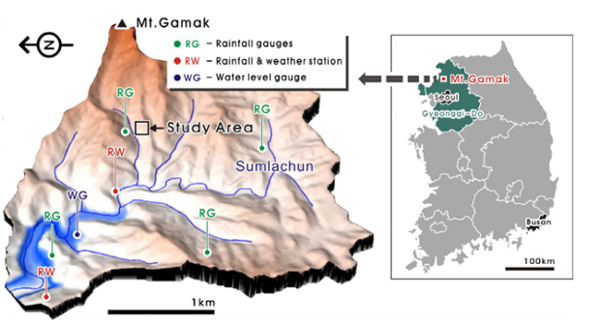
| 15:26, 10 September 2015 | Sulmachun catchment.png (file) |  |
195 KB | Sulmachun catchment | 1 |
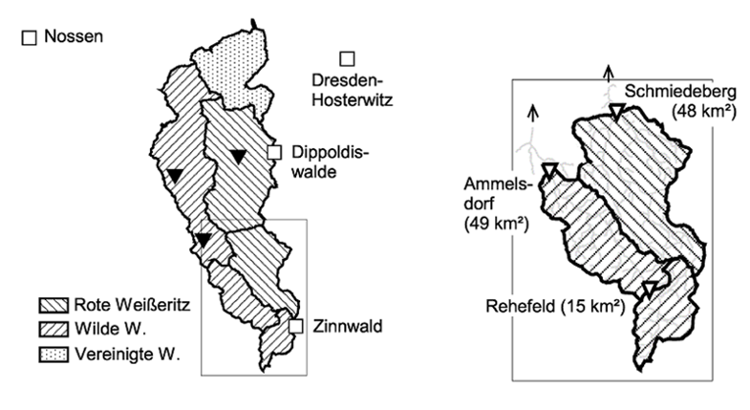
| 10:05, 27 March 2015 | Catchment.png (file) |  |
193 KB | Catchment of the complete Weisseritz catchment with gauging stations and meteorological stations of the headwaters | 1 |
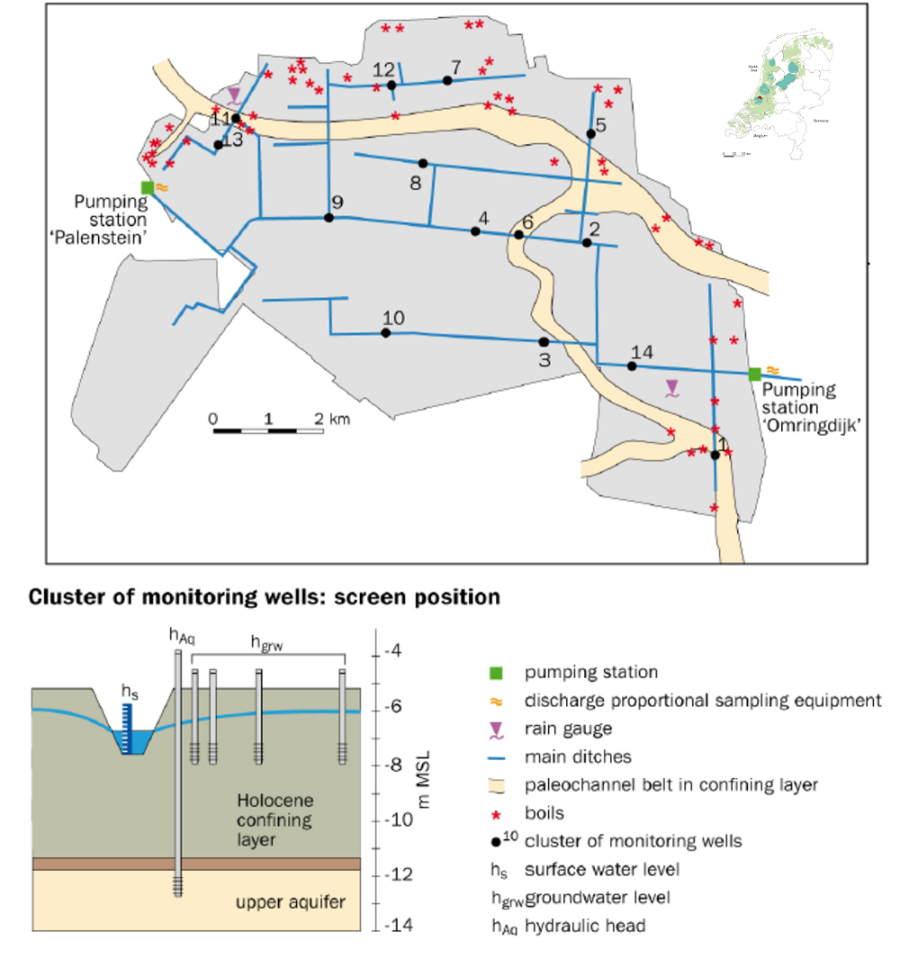
| 16:30, 15 April 2014 | Noordplas Polder.png (file) |  |
286 KB | Noordplas Polder drainage area after de Louw et al. 2011, modified | 1 |
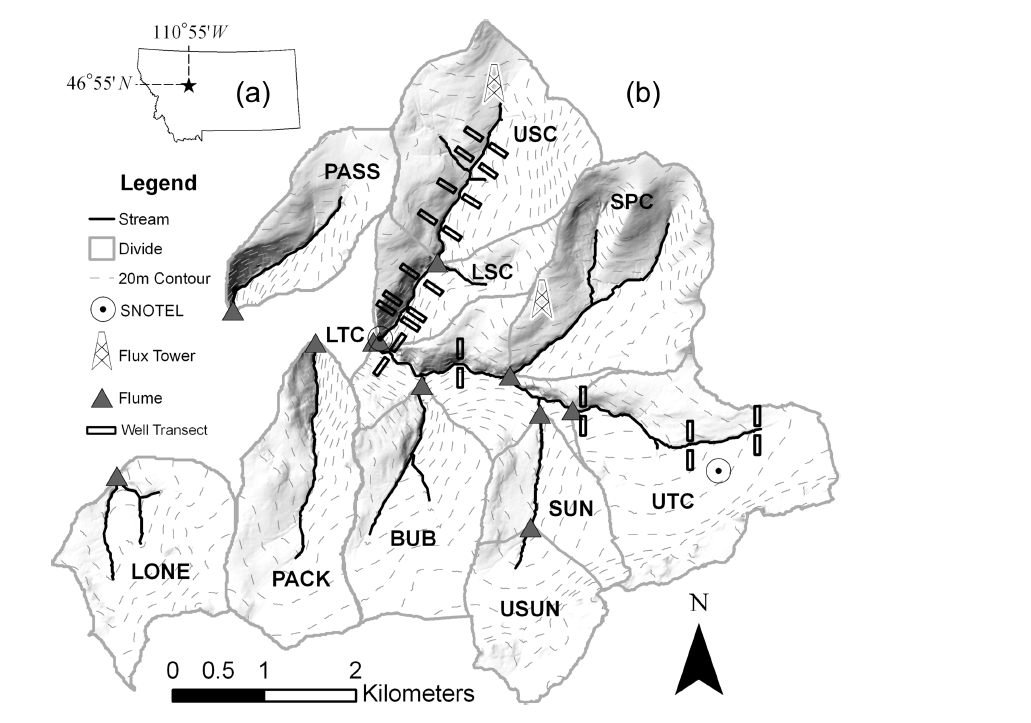
| 14:49, 9 April 2014 | Tenderfoot experimental Watershed.png (file) |  |
290 KB | Tendefoot experimental watershed after Jencso et al. 2011 | 1 |
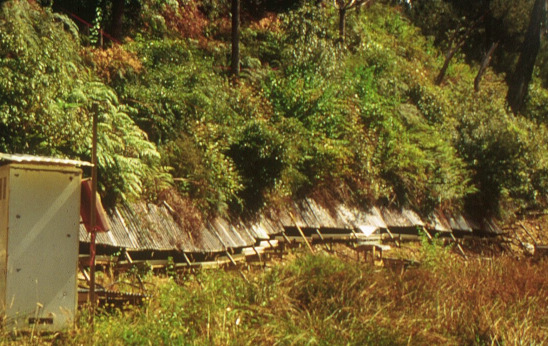
| 14:31, 6 February 2014 | Maimai throughfall trench.png (file) |  |
401 KB | Hillslope throughfall trench | 1 |
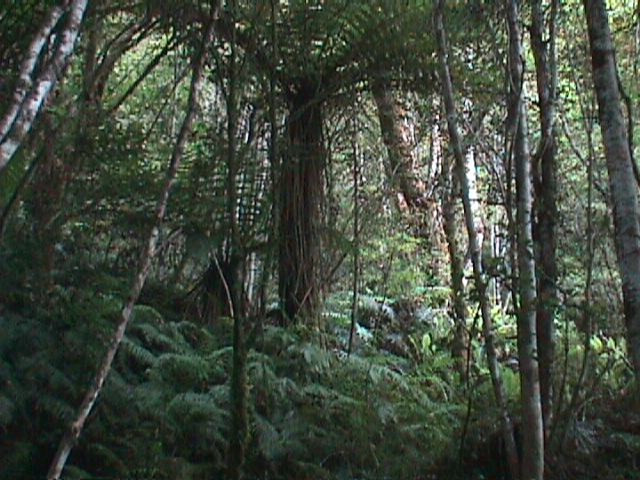
| 14:31, 6 February 2014 | Maimai vegetation patterns.png (file) |  |
581 KB | Typical vegetation in the MaiMai catchment | 1 |
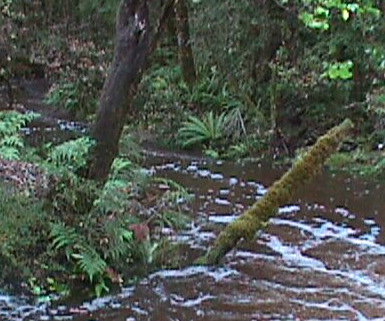
| 14:30, 6 February 2014 | Maimai stream and riparian zone.png (file) |  |
251 KB | View on stream and riparian zone in the main catchment | 1 |
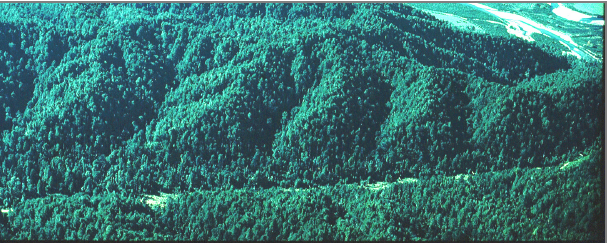
| 13:41, 6 February 2014 | Maimai areal view.png (file) |  |
391 KB | areal view into the MaiMai catchments by Lindsay Rowe | 1 |
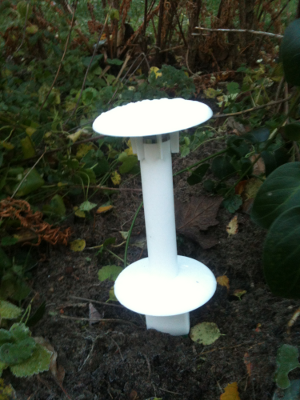
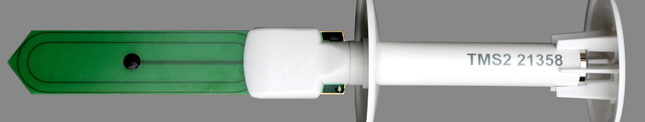
| 10:49, 25 November 2013 | TMS porbe installed.png (file) |  |
197 KB | 1 | |
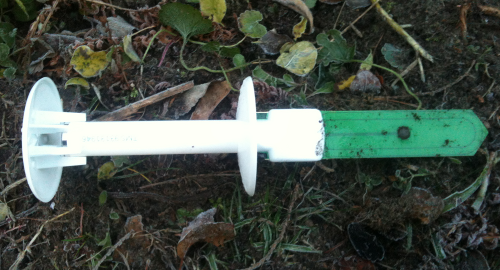
| 10:43, 25 November 2013 | Tms probe.png (file) |  |
280 KB | 1 | |
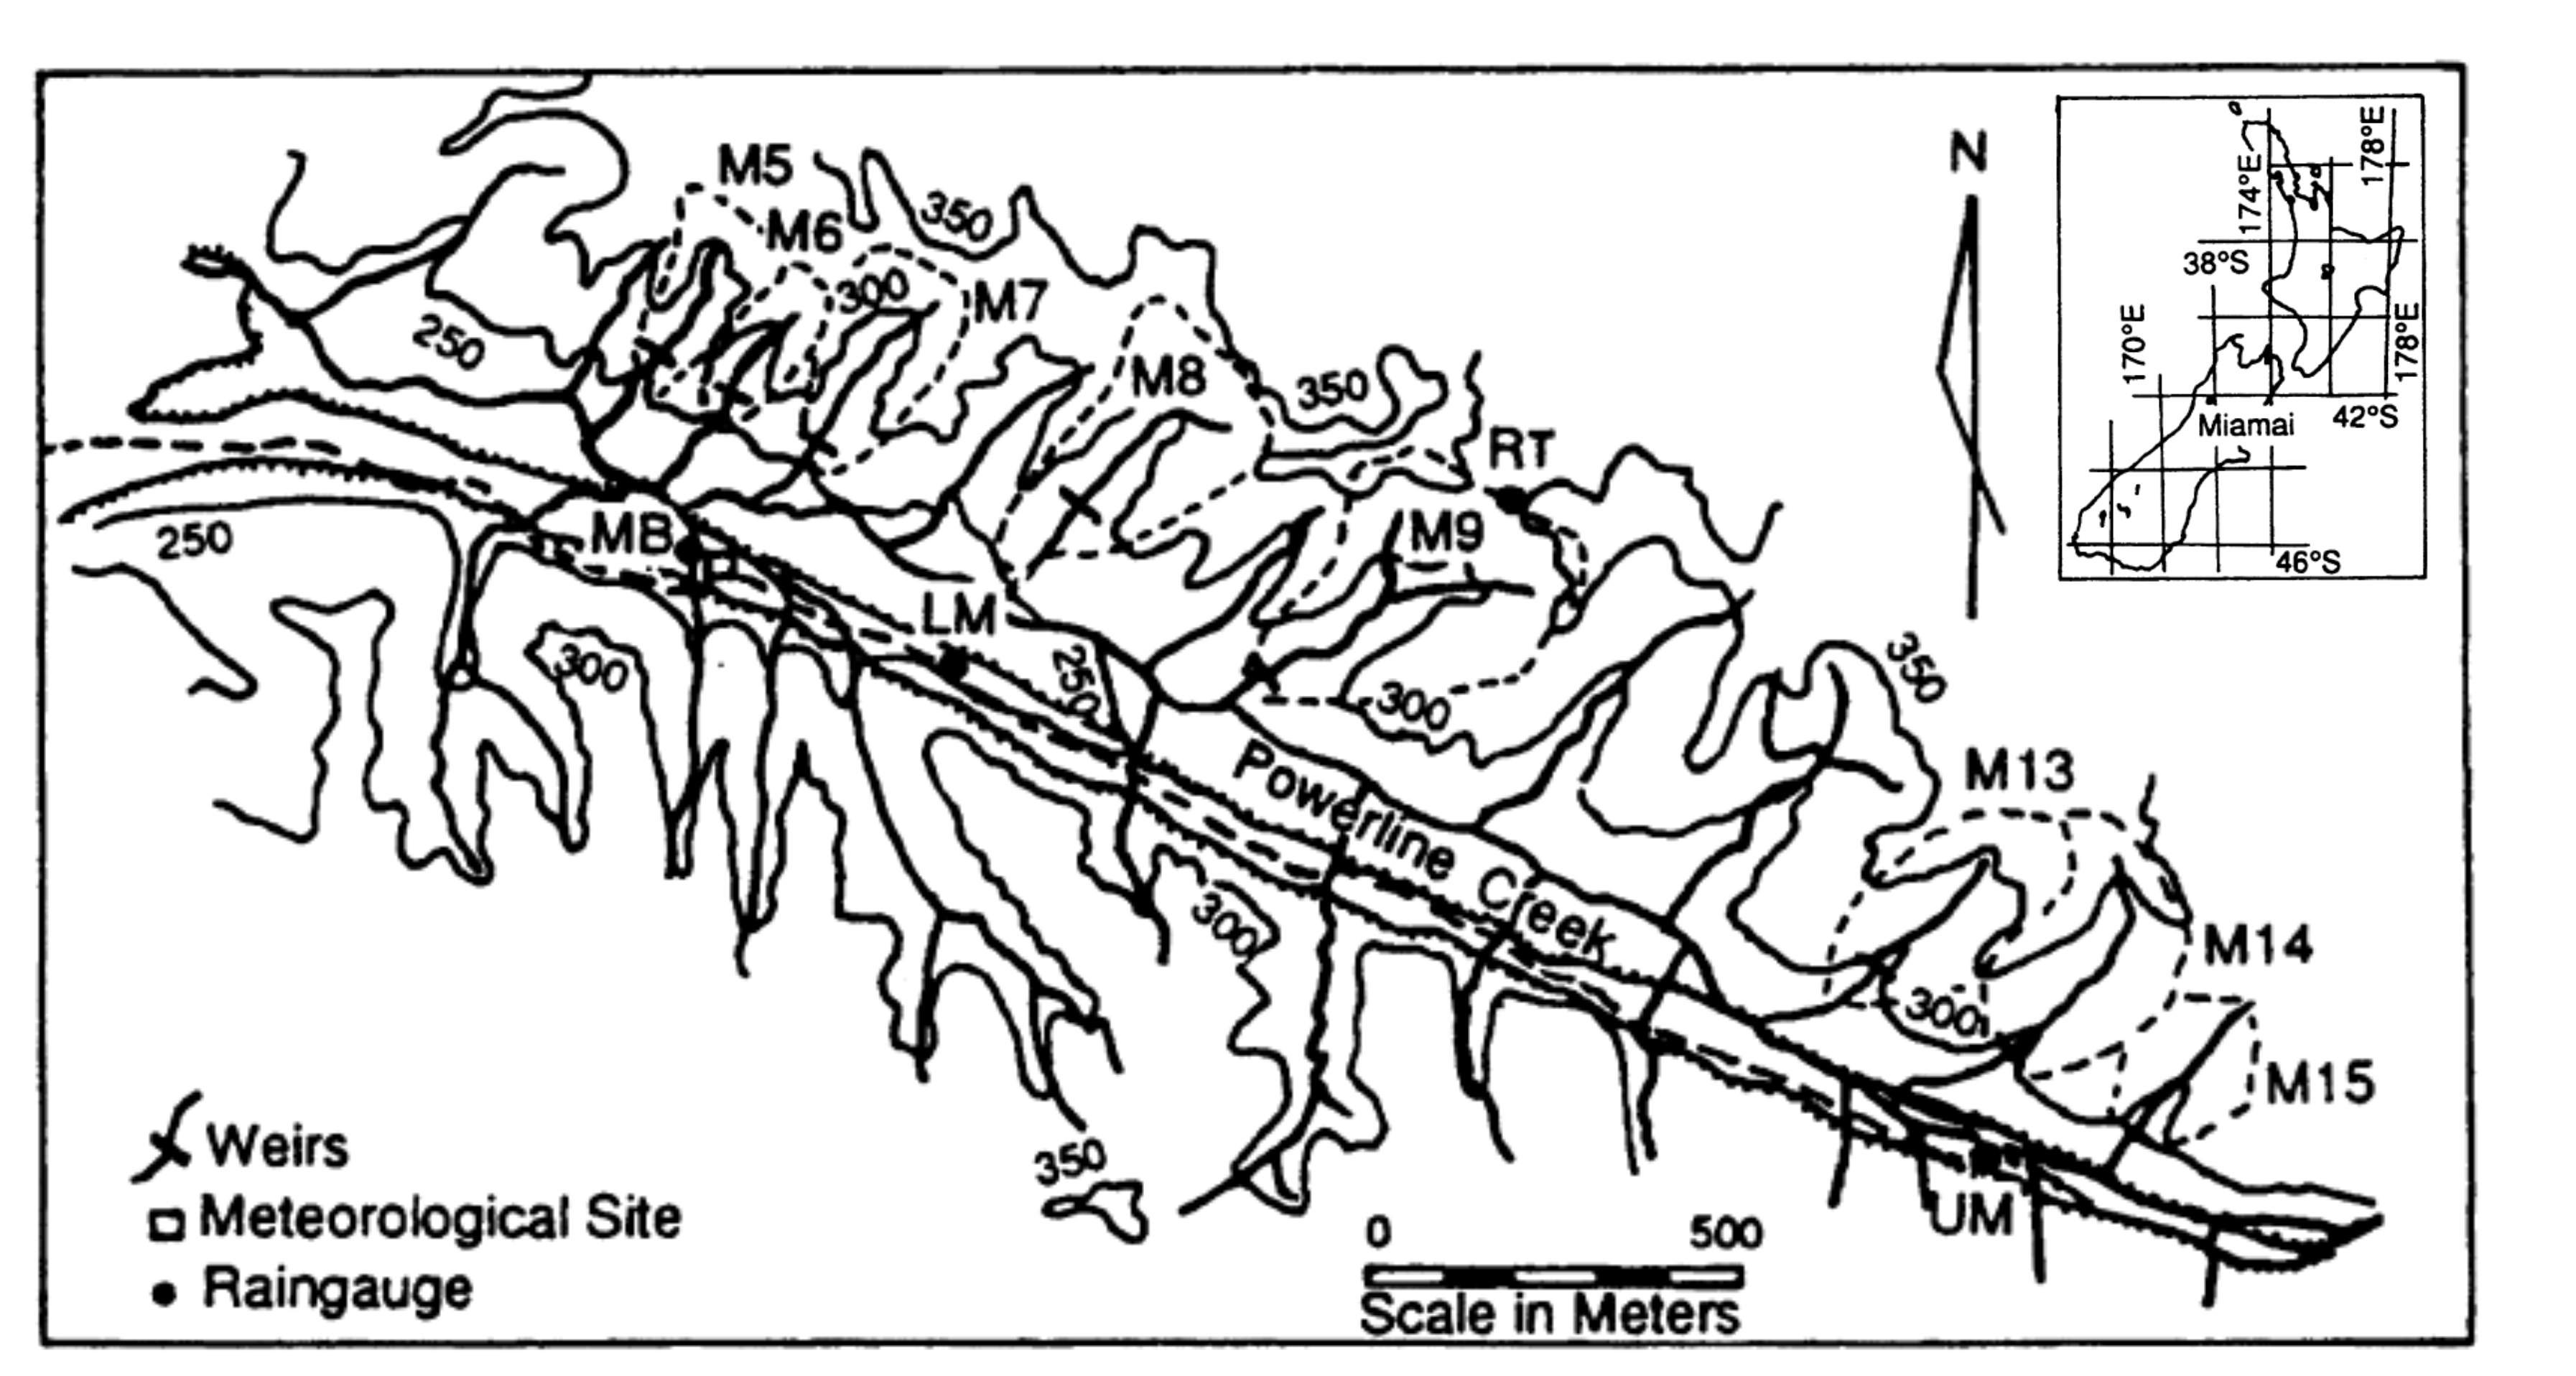
| 11:39, 14 November 2013 | Maimai 2.png (file) |  |
1.94 MB | Experimental catchments of MaiMai New Zealand | 1 |
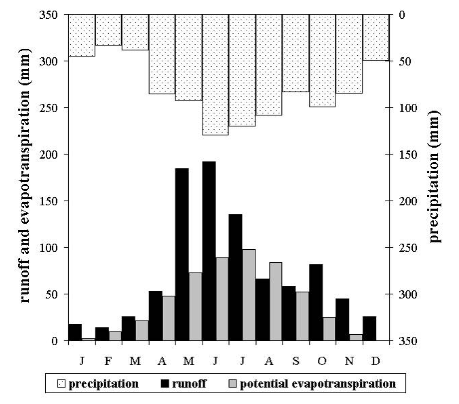
| 15:59, 12 November 2013 | Climatic conditions Rio Vauz.png (file) |  |
83 KB | Climatic conditions in the lower Vauz catchment | 1 |
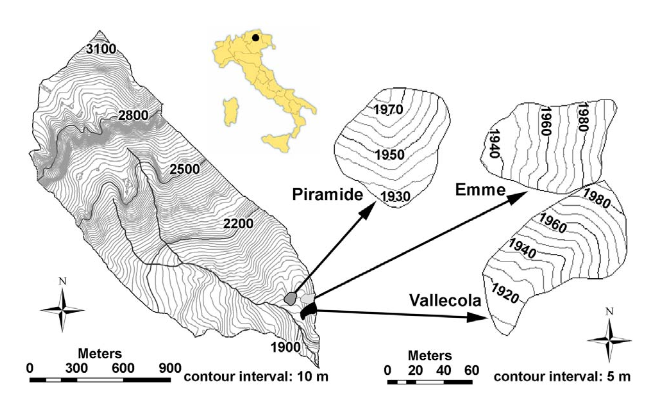
| 15:56, 12 November 2013 | Rio vauz.png (file) |  |
230 KB | Rio Vauz catchment, Italien Alps | 1 |
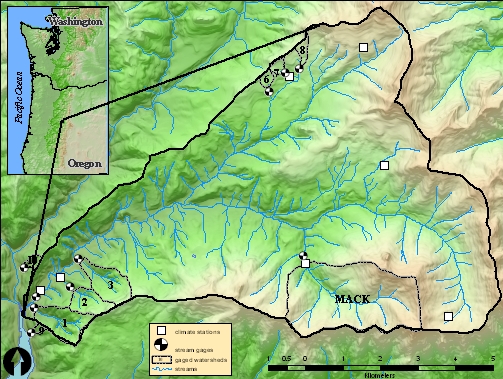
| 00:04, 10 November 2013 | HJ Andrews.jpg (file) |  |
240 KB | Locatin of HJ Andrews Experimental Forest | 1 |
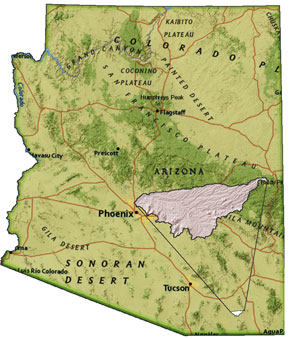
| 23:36, 9 November 2013 | WalnutGulch Map.jpg (file) |  |
36 KB | Location of the Walnut Gulch Experimental Watershed, Arizona, USA | 1 |
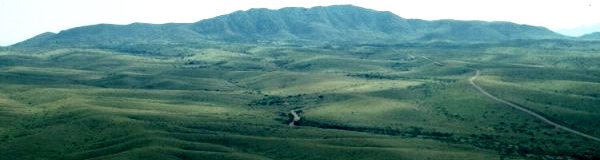
| 23:20, 9 November 2013 | Wng.jpg (file) | 19 KB | View into the Walnut Gulch Experimental Watershed | 1 | |
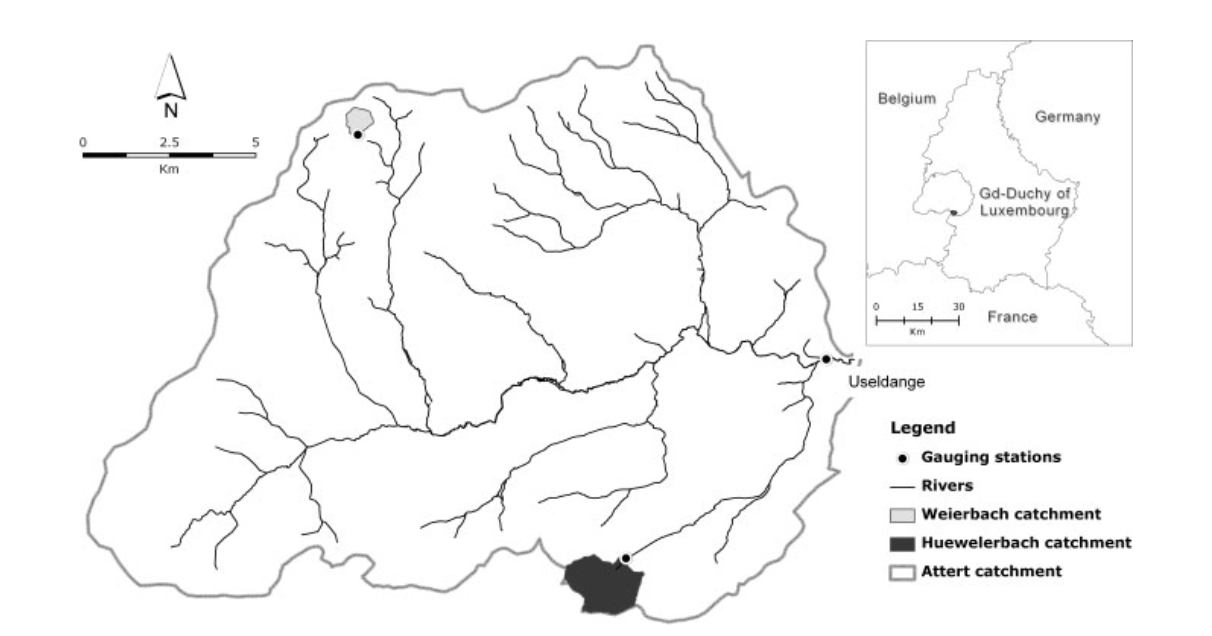
| 22:56, 9 November 2013 | Attert catchment.png (file) |  |
270 KB | Attert catchment Luxembourg | 1 |
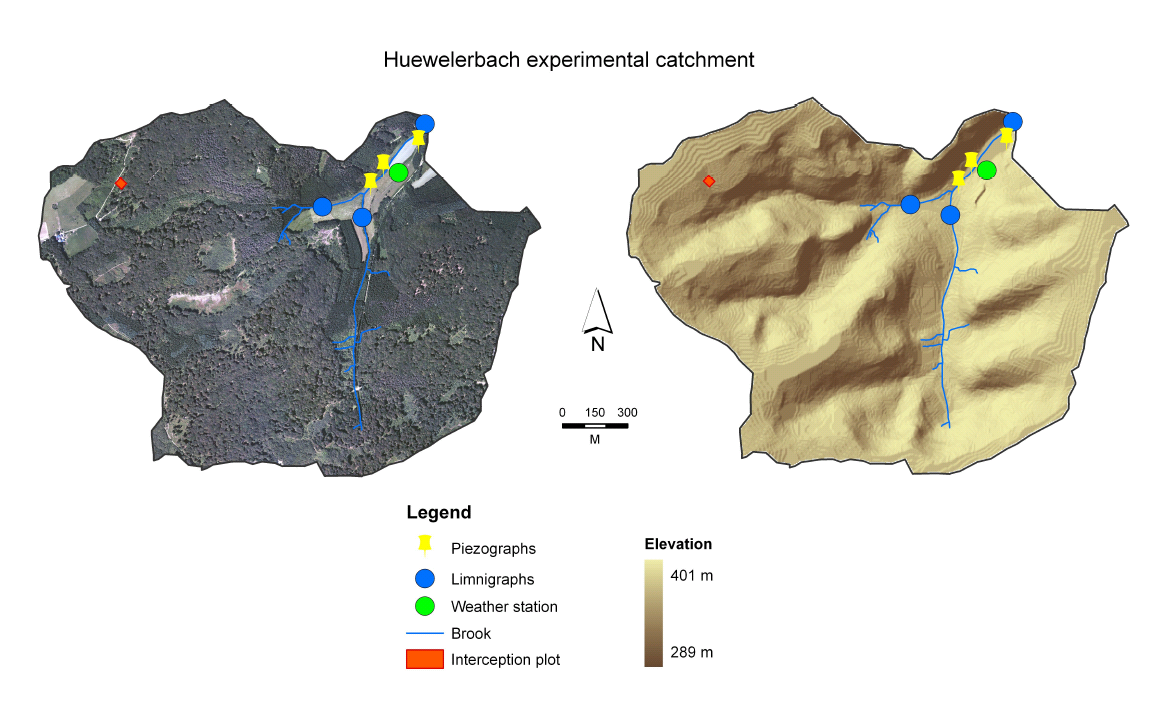
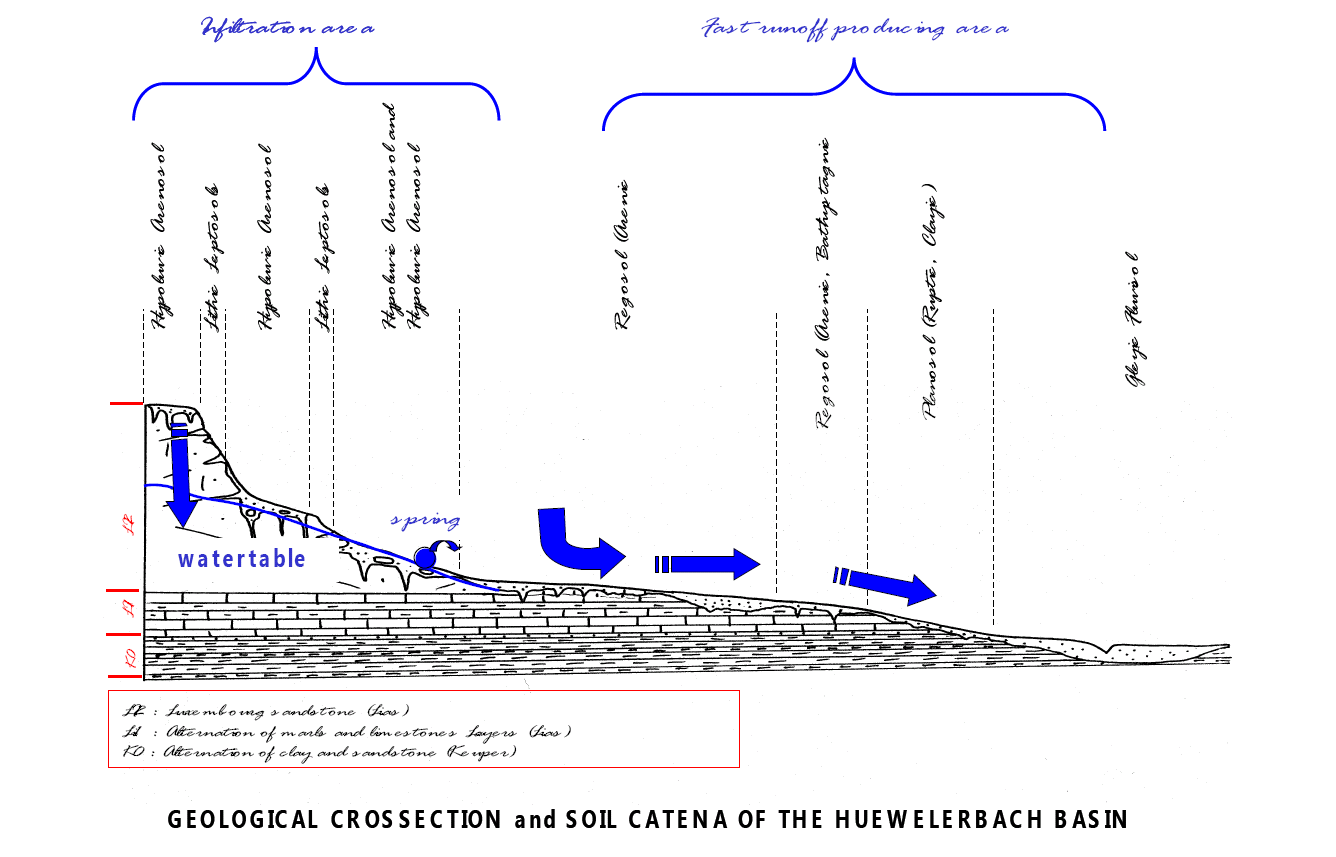
| 11:39, 8 November 2013 | Catchment Huewellebach.png (file) |  |
561 KB | Huewellebach catchment with channel network and devices | 1 |
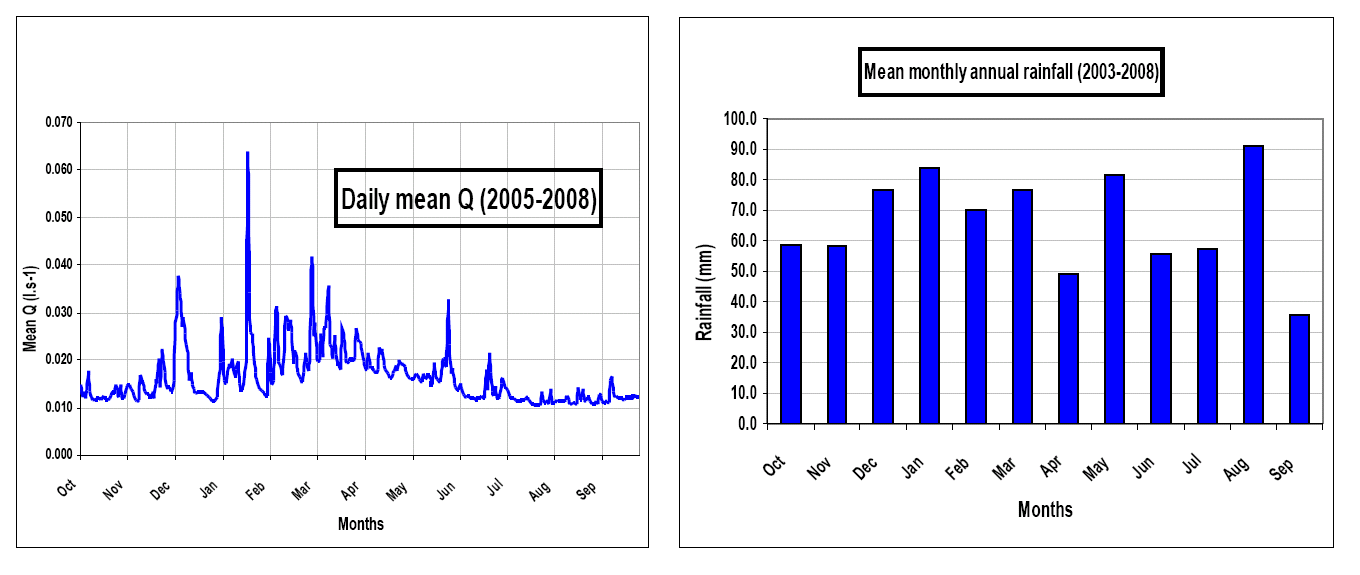
| 11:34, 8 November 2013 | Q P Huewellebach.png (file) |  |
66 KB | Anual responce of P and Q in the Huewellebach | 1 |
| 11:31, 8 November 2013 | X.png (file) |  |
156 KB | 1 | |
| 09:53, 8 November 2013 | Ml3 deltaT.jpg (file) |  |
15 KB | delta T ML3 probe | 1 |
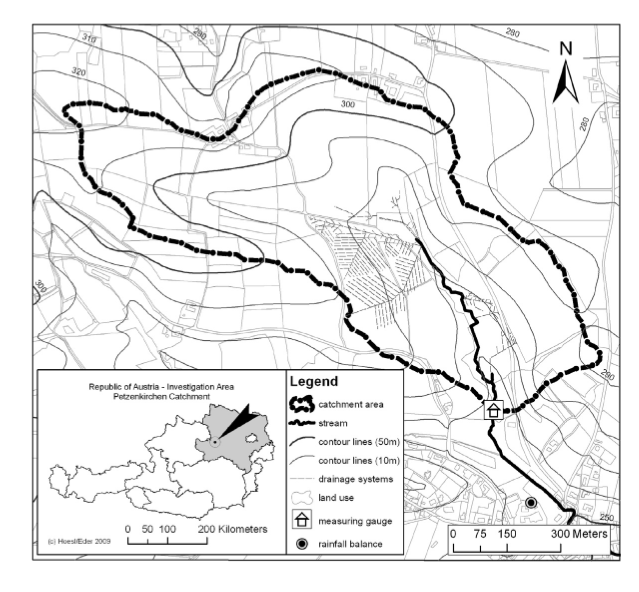
| 13:20, 7 November 2013 | HOAL.png (file) |  |
292 KB | Catchment HOAL | 1 |
| 09:32, 26 September 2013 | Tms1.jpg (file) | 31 KB | TMS soil moisture sensor | 1 | |
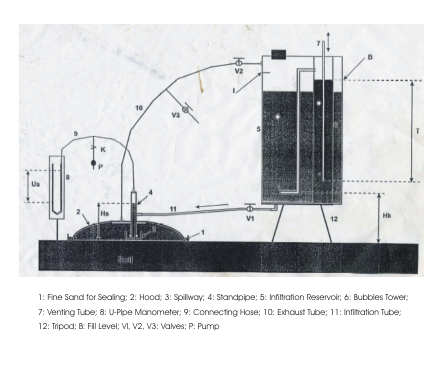
| 15:51, 14 March 2013 | Hood infiltrometer.png (file) |  |
198 KB | Sketch of hood infiltrometer | 1 |
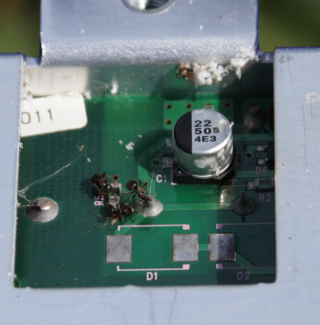
| 12:51, 21 February 2013 | Dead ants.png (file) |  |
173 KB | Dead ants on logger circuit board | 1 |
| 12:39, 21 February 2013 | Ant track.png (file) |  |
183 KB | ant track on cable in logger box | 1 |
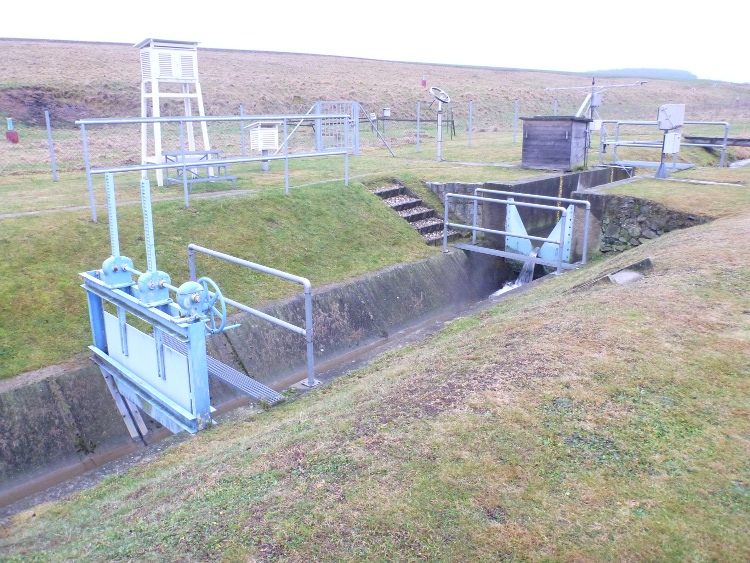
| 11:42, 10 January 2013 | Weir Schaefertalbach.JPG (file) |  |
239 KB | V-weir of the Schäfertal with meteorological station. | 1 |
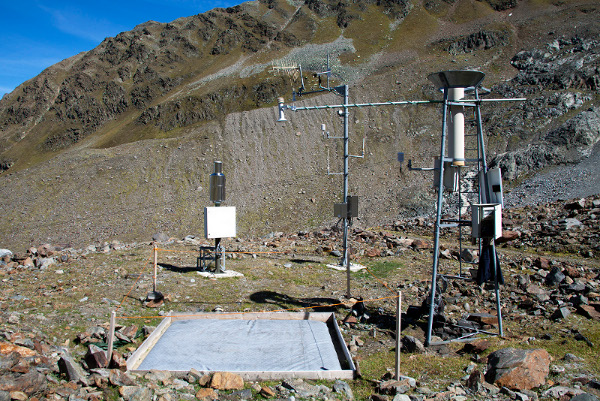
| 10:33, 30 November 2012 | Snow pillow Kaunertal.jpg (file) |  |
194 KB | Snow pillow in the Kaunertal Austria Alps | 1 |
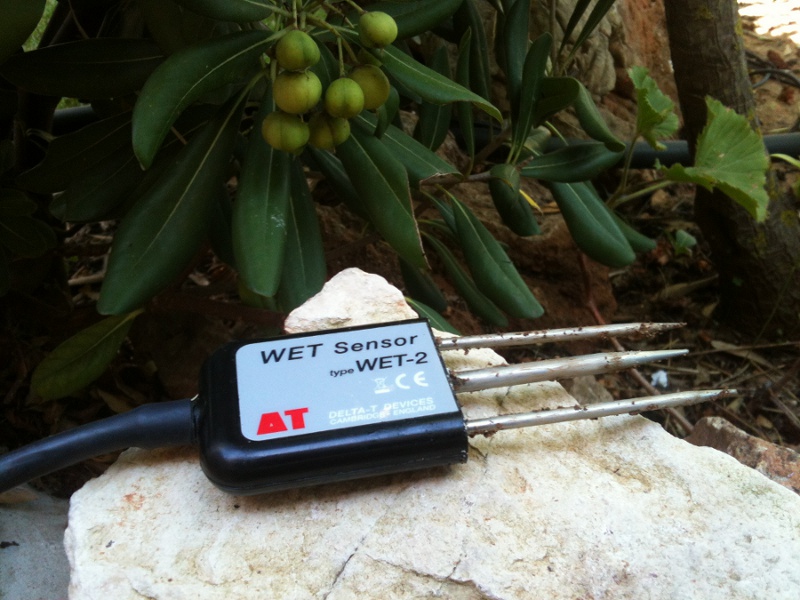
| 12:49, 17 October 2012 | Wetsensor.jpg (file) |  |
190 KB | detail image of the delta t Wet sensor | 1 |
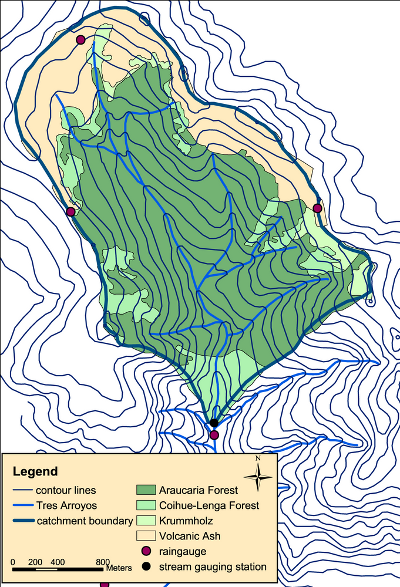
| 17:18, 9 February 2012 | Mapkl.png (file) |  |
276 KB | Malalcahuello catchment Chile | 1 |
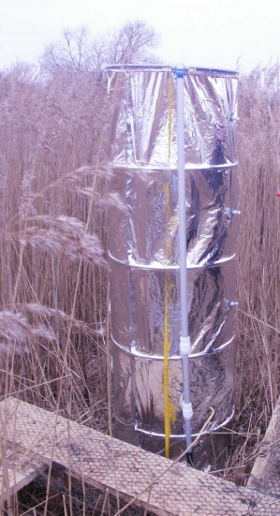
| 16:57, 8 February 2012 | HM chamber.png (file) |  |
292 KB | Chamber measurment of CH4 | 1 |
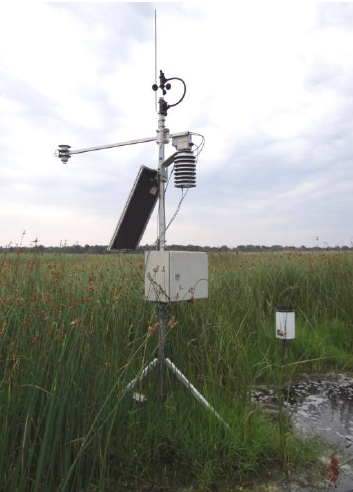
| 16:55, 8 February 2012 | HM meteorology.png (file) |  |
217 KB | Meteorological station Hüttelmoor | 1 |
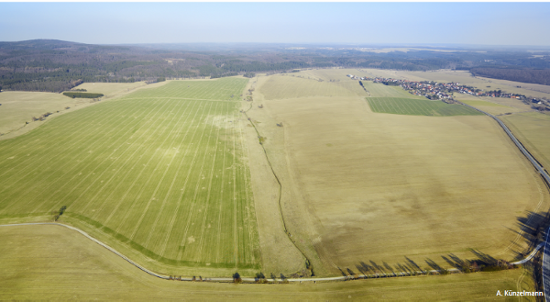
| 13:32, 6 February 2012 | Areal view Schaefertal.png (file) |  |
273 KB | areal view Schäfertal catchment | 1 |
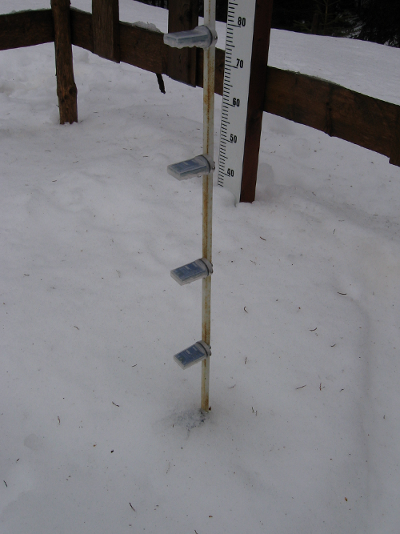
| 13:19, 6 February 2012 | HOBO snow.png (file) |  |
281 KB | Snow hight via temperature | 1 |
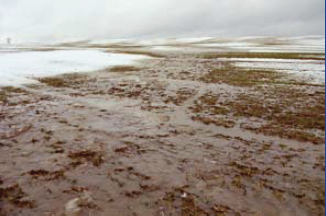
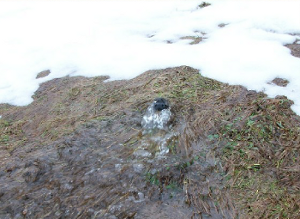
| 09:40, 13 October 2011 | Snow overland flow schaefertal.png (file) |  |
122 KB | overland flow on snow cover Schäfertal | 1 |
| 11:32, 25 September 2011 | Pipeflow Weisseritz.png (file) |  |
129 KB | pipeflow hillslope in the headwater of the Weisseritz river close to gauge Rehefeld | 1 |